Results – Germination
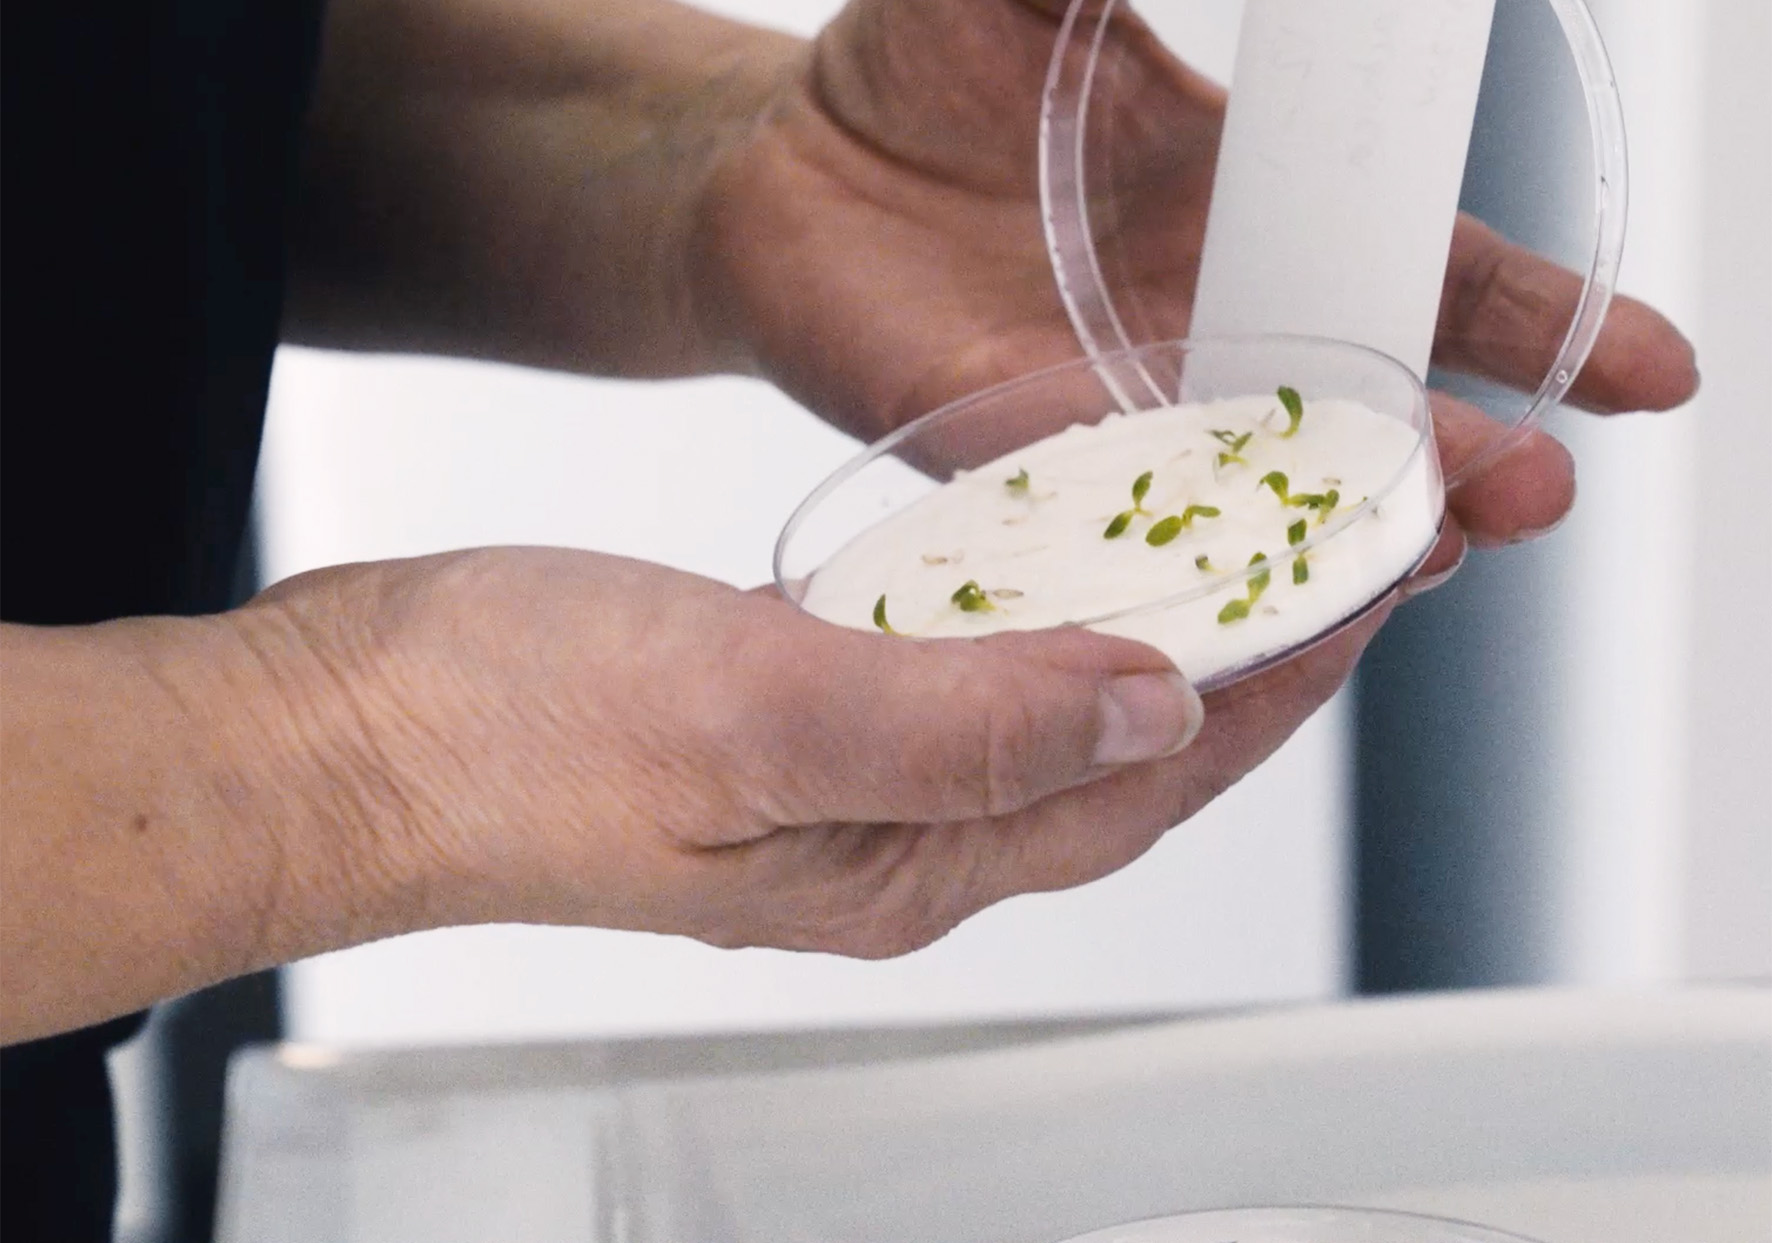
Germination results at the start and after 35 years of storage are listed in Annex 1. Graphs showing development and changes in germination over the years are shown crop group wise in figures 1-6 below. Results include both Series A and Series B. Remaining germination ability of initial germination percentage after 35 years is shown in figure 7. Results grouped according to the two analysing seed labs are shown Iin figure 8.
After 35 years the 100 year experiment has revealed considerable differences between crop groups, but also differences between species and cultivars within the same species were observed.
The most long-lived seeds in this experiment, displayed as minimal loss of germination percentage over 35 years, have been the vegetable seeds: cucumber, lettuce, onion, beet, cauliflower and carrots.
The picture is more varied within cereal, grass and legume species. Among cereals, barley seeds have maintained a high level of seed germination over 35 years. Wheat and rye have declined significantly in viability, in particular during the last 15 years. Among the grasses some species and some cultivars have maintained viability while others have declined. Among legumes, red clover has maintained germination ability very well whereas the three cultivars of pea show mixed results.
Germination Results Cereals
Figure 1. Germinations results of cereal crops, barley (2 varieties), rye (2 varieties) and wheat (4 varieties).
Germination Results Forage Grasses
Figure 2. Germinations results of forage grasses, perennial raigrass (2 varieties), timothy (2 varieties), meadow fescue (1 variety) and Kentucky bluegrass (2 varieties).
Germination Results Legumes
Figure 3. Germinations results of legume crops, red clover (Trifolium pratense) (2 varieties) and pea (Pisum sativum) (3 varieties). (Results for the pea variety ‘Weitor 2’ is not included in further summarizing analysis).
Germination results Beta and Brassica
Figure 4. Germinations results of Beta (1 variety) and Brassica species (3 species/varieties).
Germination Results Onion and Lettuce
Figure 5. Germinations results of onion (Allium cepa) (3 varieties) and lettuce (Lactuca sativa) (3 varieties).
Germination Results Cucumber and Carrot
Figure 6. Germinations results of Cucumber (Cucumis sativus) (2 varieties) and carrot (3 varieties).
Remaining Germination Percentage
Figure 7. Remaining germination percentage of 17 crop species after 35 years storage as average of the cultivars included (number of cultivars in brackets). The results for pea show the average for two cultivars with very high germination. One cultivar with close to zero germination is not included in the average shown here. (See Figure 3 for details).
As explained, from 2021, the two series of experimental materials have been analysed in two different seed labs. Series A comprising 31 samples of 16 crops have been analysed at the NordGen seed lab in Alnarp, while series B comprising 10 samples with seeds of nine species have been analysed at Kimen seed lab in Ski, Norway. Analysis of seeds in series B have included test of survival of seed borne pathogens in addition to germination tests.
The total plant health status is not known for any samples/series. The only background information available is that samples in Series B are contaminated with the pathogens listed in table 2. The pathogens involved are mainly problematic when cultivating the plants in field conditions. The possible effect of the pathogens on germination is not studied.
As eight out of nine species in Series B are represented also in Series A, a comparison between germination results in the two series is shown in Figure 8. Average remaining germination percentage of crops in Series A is 83,0%, while it is 85,8% in Series B. There are no systematic trends in this comparison, and the experimental material is too scarce to draw any conclusions regarding the effect of either pathogen contamination or differences between the two seed labs.
